Apply to create account -> mailto:apply [snail] wiki [period] audio
Sounds of Silence: Comparison study of Frequency Response and Sound Isolation in Earmuff Headphones
Current version of the page has been reviewed and is approved ().
Abstract
'Sounds of Silence’ presents research conducted on nine sound isolation headphone models regarding their ability to reconstruct frequency information and passively isolate the user from external noise. Frequency response measurements were recorded binaurally by a Neumann KU 100 dummy head in an anechoic chamber, as each pair of headphones recreated a sweep stimulus. Frequency attenuation (sound isolation) was measured as a sinusoidal sweep playback via external loudspeaker in the chamber, while the dummy head recorded leakage through each headphone pair. Both measurement sets were performed multiple times to account for headphone placement variability. Visual results highlight significant variations in performance across the models, particularly in their reproduction and attenuation of very low and high frequencies. To enable perceptual evaluation, impulse responses were derived from the measured data and convoluted to create auralizations of each headphone. The audio results not only confirm the quantitative data, but offer a tangible comparison of the overall tone quality and listening experience of each headphone (see Audio Results).
Materials and Methods
Headphone Selection
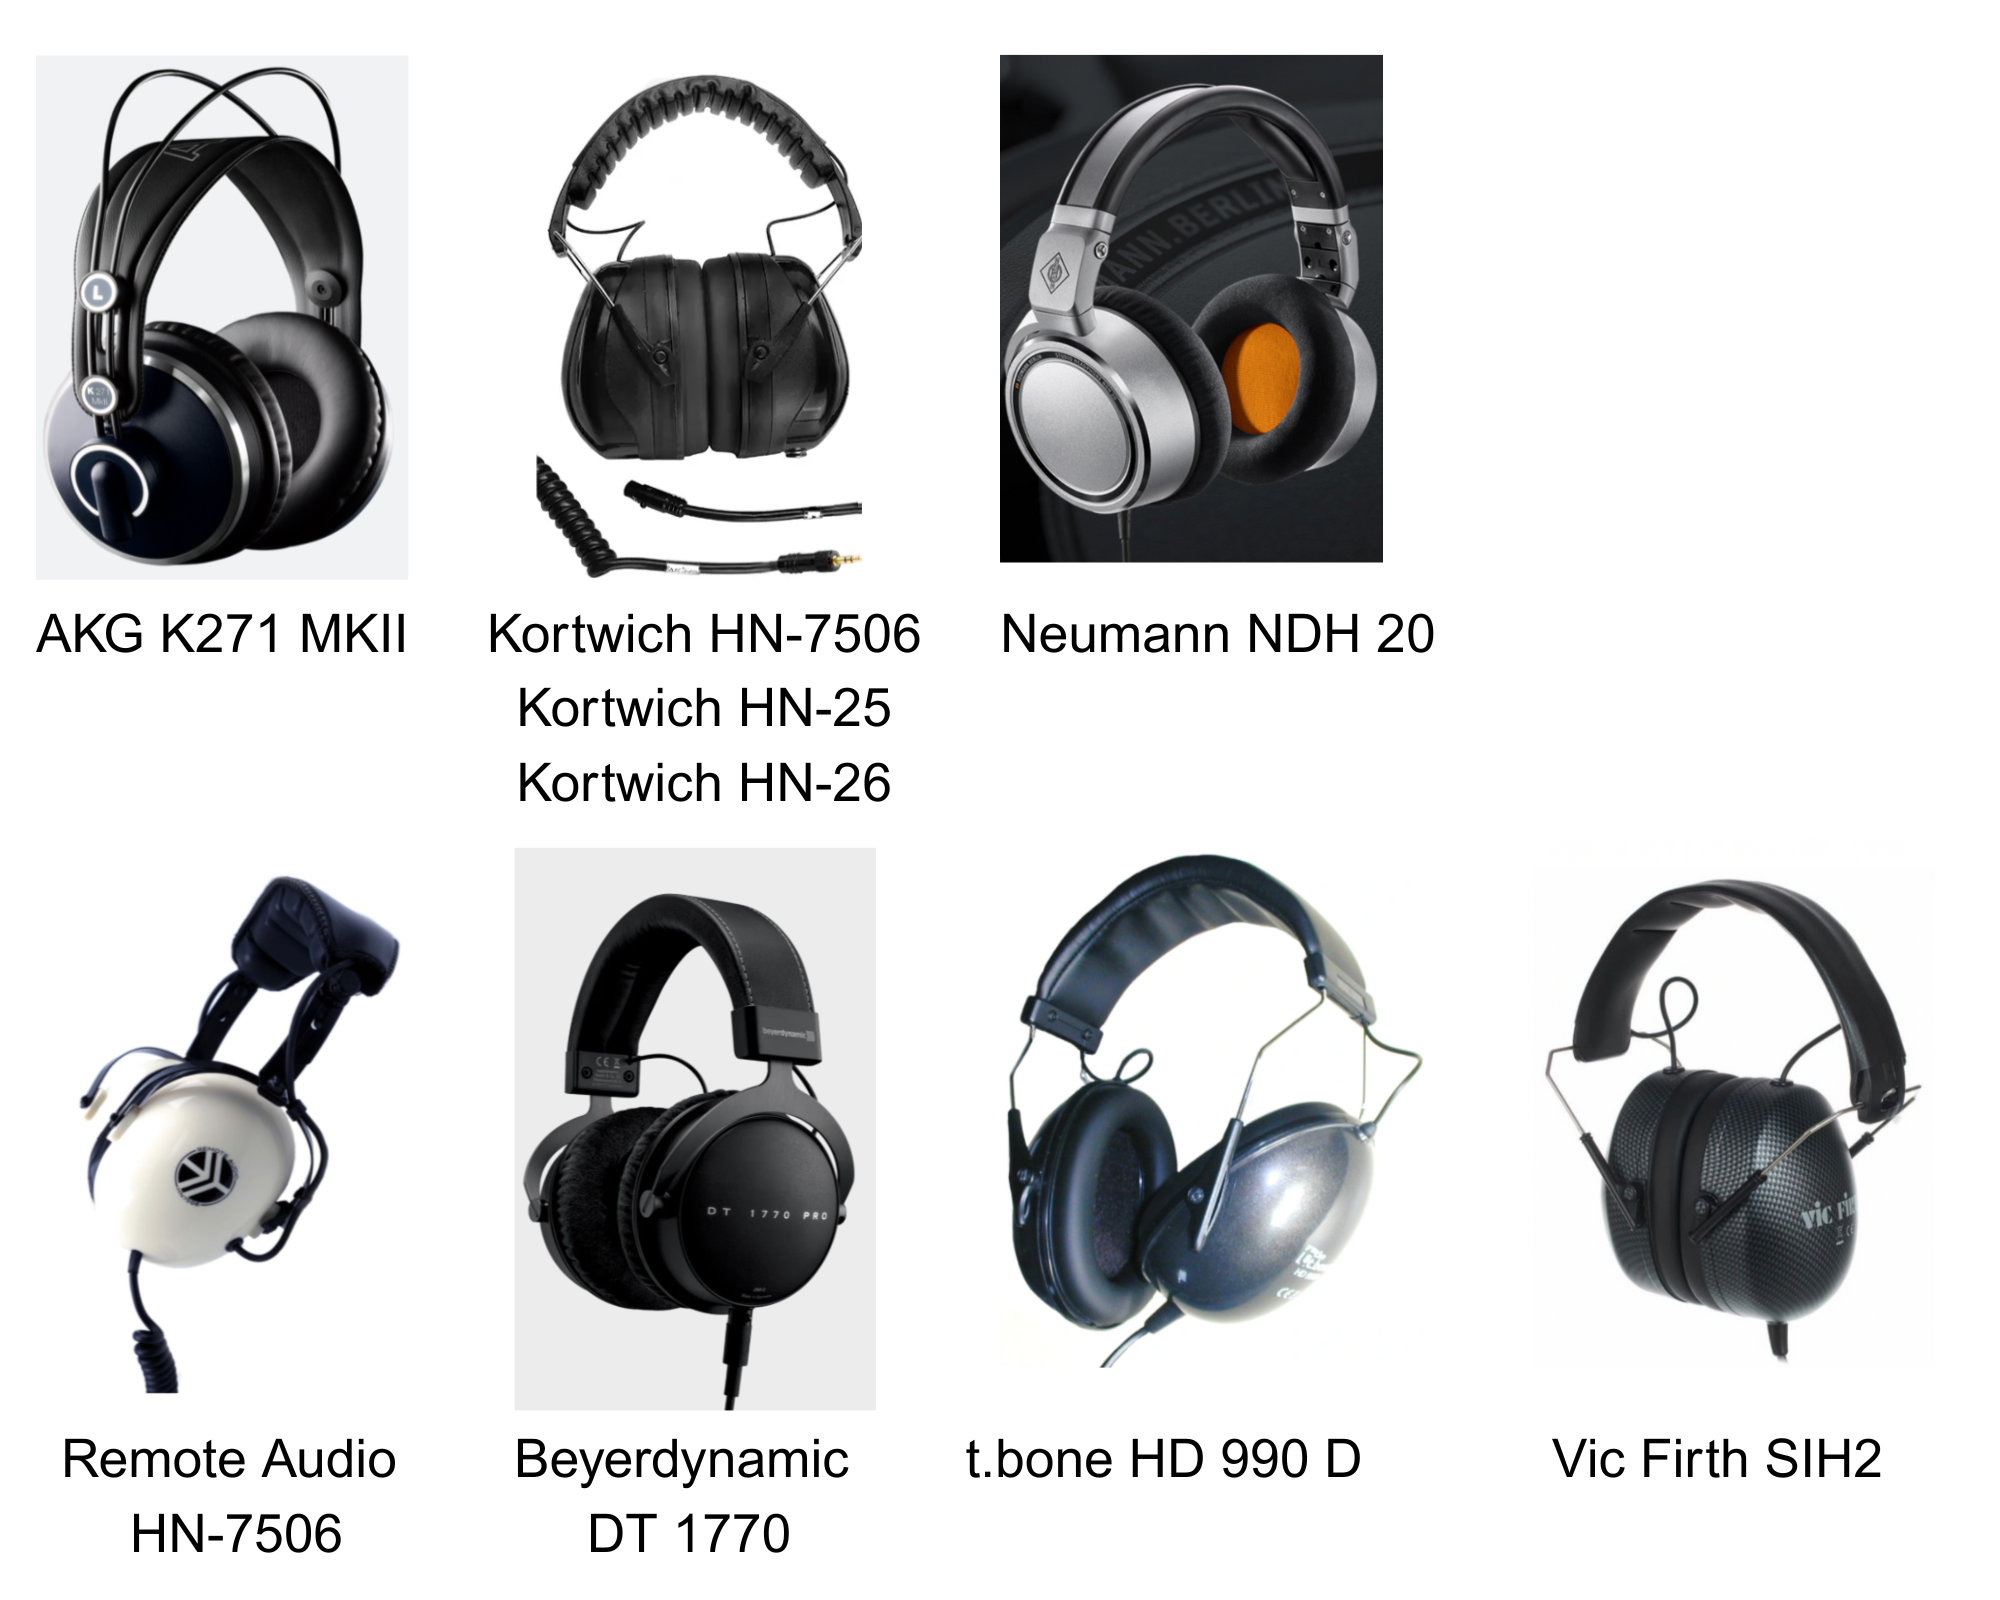
This study was limited to closed earmuff style headphones. Within this subsect, a deliberately varied set of headphones was chosen measurement, spanning a range of price points and intended applications. The Neumann (NDH20) and Beyerdynamic (BDDT1770) models are studio headphones, often utilized by sound engineers and other audio professionals because of their accurate frequency reproduction capabilities. The Vic Firth (SIH2) and t.bone (HD990) models are lower-end models, primarily designed for drummers as hearing production and secondarily, playback. The Kortwich headphones (HN25, HN26, HN7506), which share a shell model, but utilize different drivers, serve as a useful control group for the sound isolation tests. Of particular note is the HN-26 prototype, specially allocated for this project, which combines the driver of the Sennheiser HD-26 with the Kortwich designed earmuff. The Remote Audio (RA) headphones were designed for high-noise field recordings, using the Sony MDR-7506 driver and Remote Audio shell with special baffling.
Due to technical issues affecting one or both audio channels, the t.bone and Vic Firth headphones were excluded from the frequency response measurements, and only used in the sound isolation testing.
Frequency Response Measurements
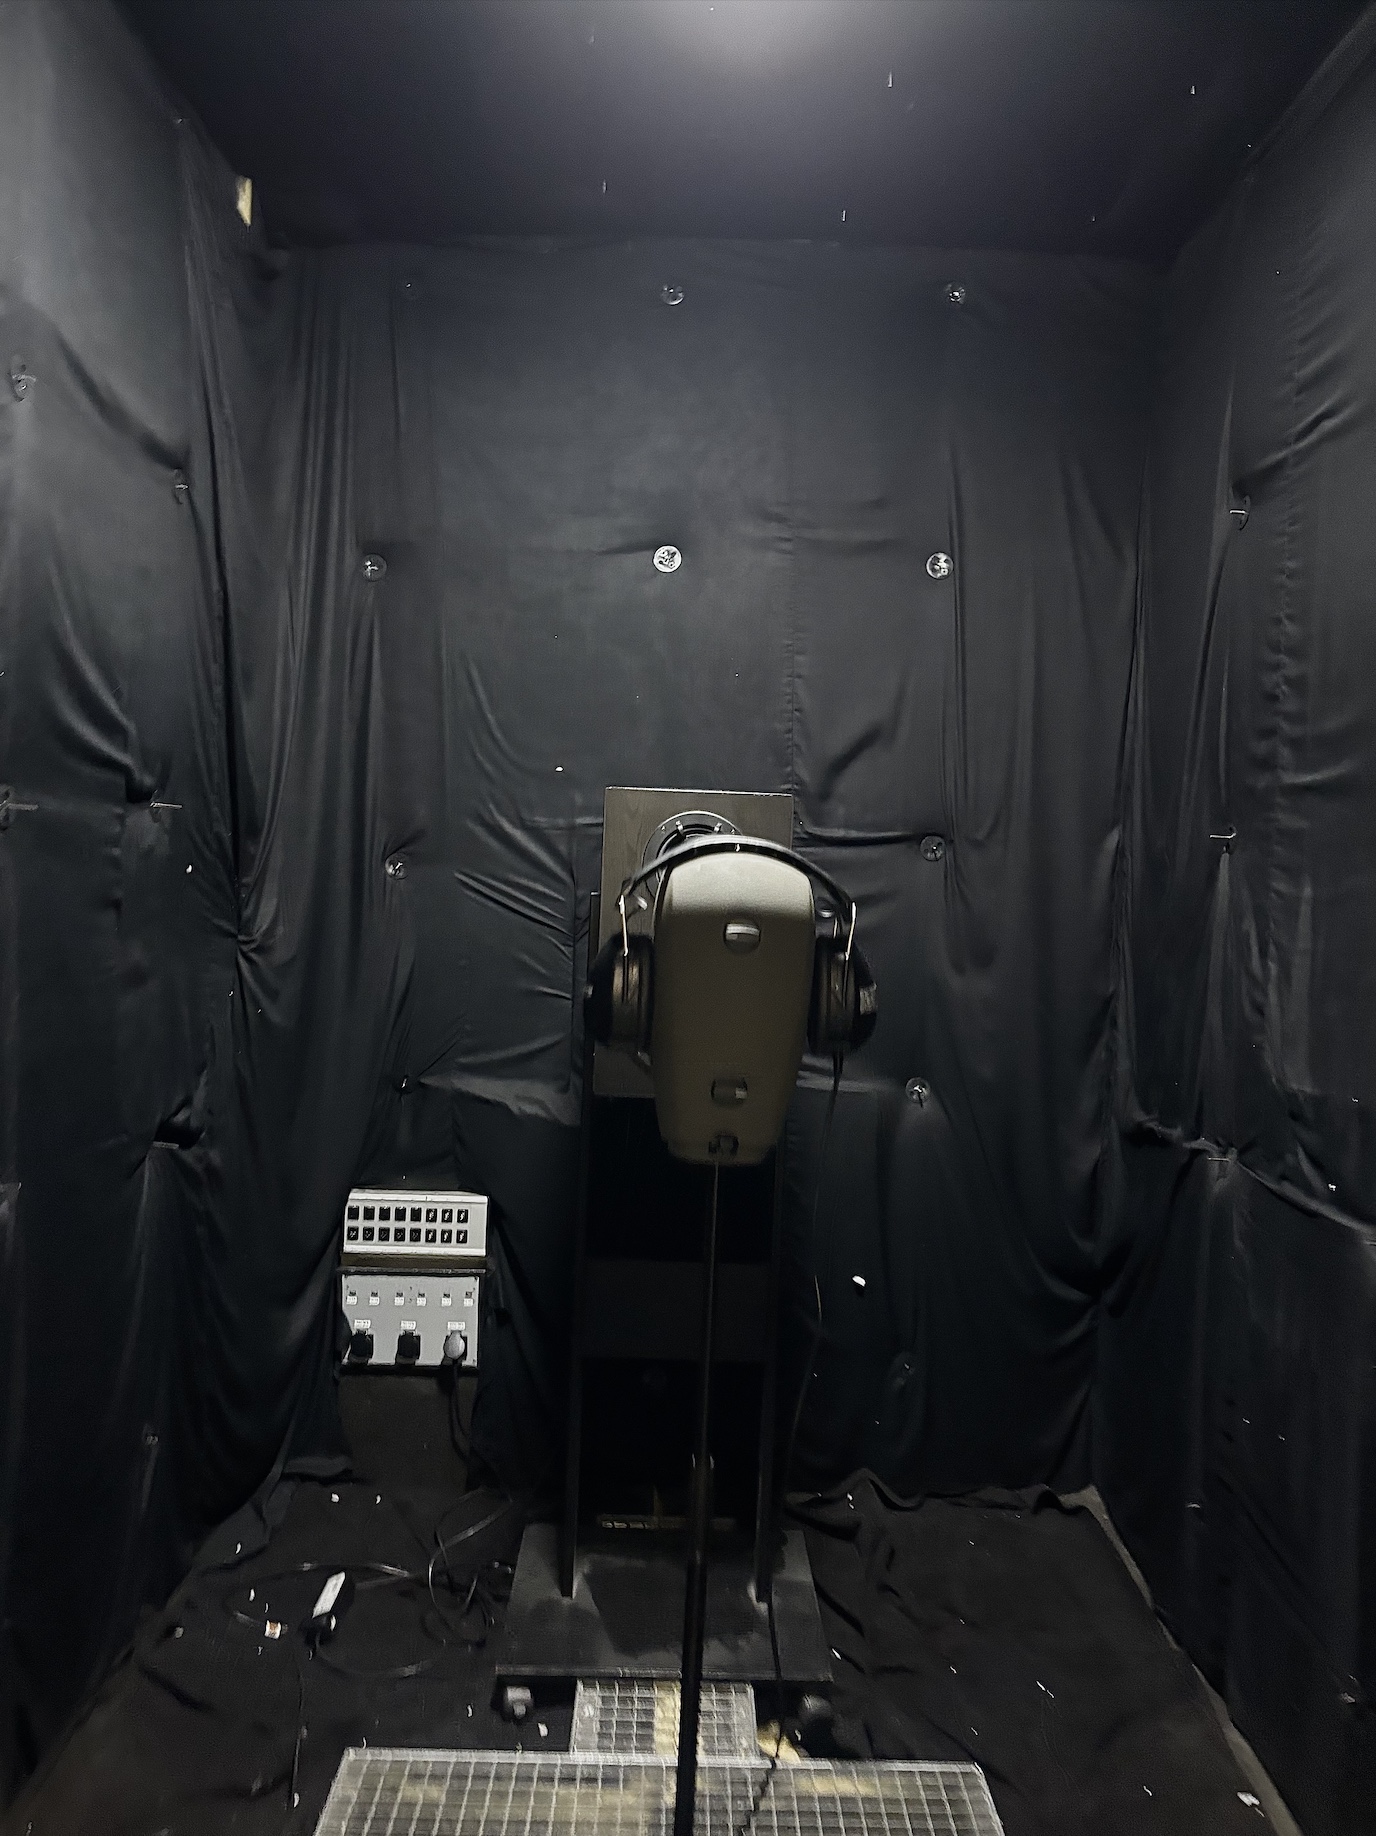
To evaluate the frequency response of each headphone, a Neumann KU 100 dummy head with binaural recorFigure 1: Measurement setup for both SI and FR testing (loudspeaker only used for SI measurements). ding capabilities was positioned in an anechoic chamber. Using MATLAB, a sinusoidal sweep was generated, played through each headphone individually, and captured via the dummy head’s two measurement microphones. Since the perceived loudness varied between headphone models, the sweep amplitude was manually adjusted for each pair to achieve a loud yet comfortable listening level- these individual levels were documented for reference. Since even minute headphone placement variability on the head can cause changes to the acquired data, each measurement was repeated four times per headphone model, with the headphones removed and repositioned on the dummy head between each run. The resulting data was averaged to account for any variation.
Sound Isolation Measurements
In an anechoic chamber, a Neumann KU 100 dummy head with binaural recording capabilities was positioned approximately one meter from a ME Geithain RL 904 loudspeaker, with its ears aligned to the center of the speaker cone. A sine sweep was played through the loudspeaker in the room and the dummy head recorded ambient sound leaking through each headphone. As in the frequency response tests, four measurements were taken for each pair, with the headphones being repositioned slightly between each run to reflect realistic variations in fit. Reproduction and recording gain were kept constant during all sound isolation measurements.
Visual Results
Frequency Response
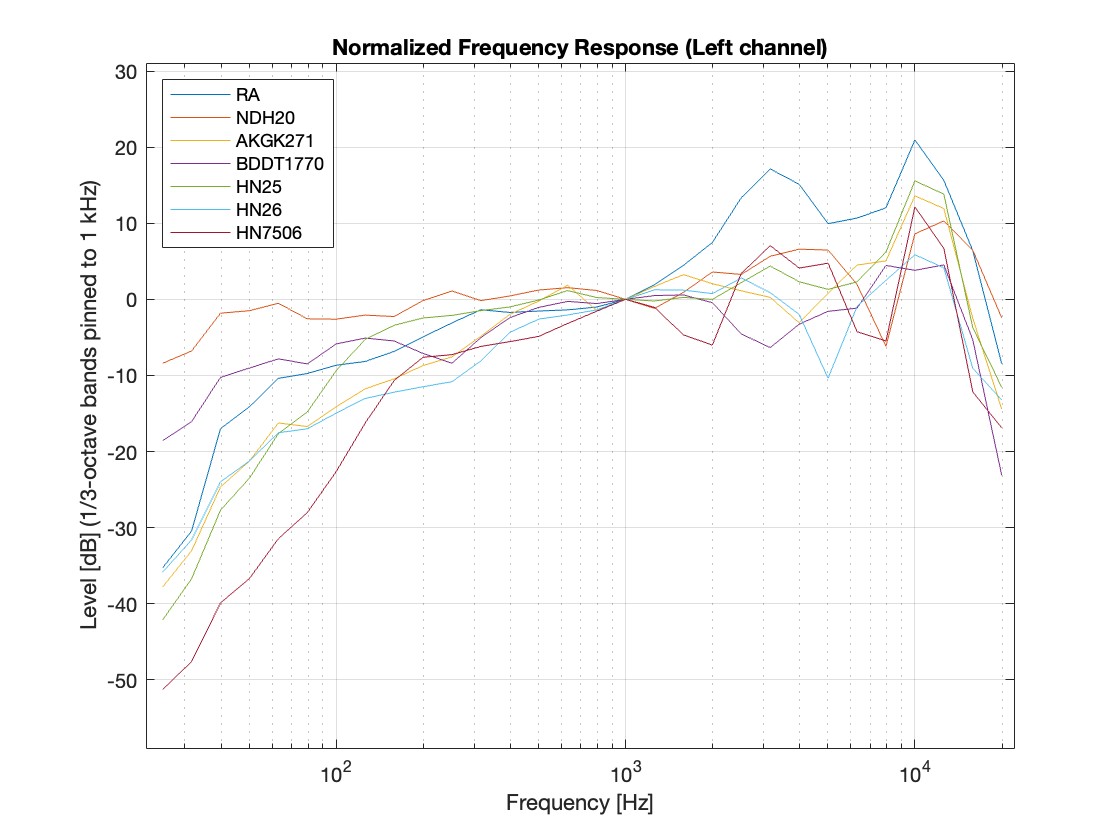
The following visual results were generated in MATLAB. For each headphone model, measurement runs were calibrated using the sensitivity of the KU 100 microphones and an average of the runs was produced to represent the headphones capabilities. A head-related transfer function (HRTF) was calculated, impulse responses were derived and displayed as 1/3 octave spectra curves to allow detailed analysis.
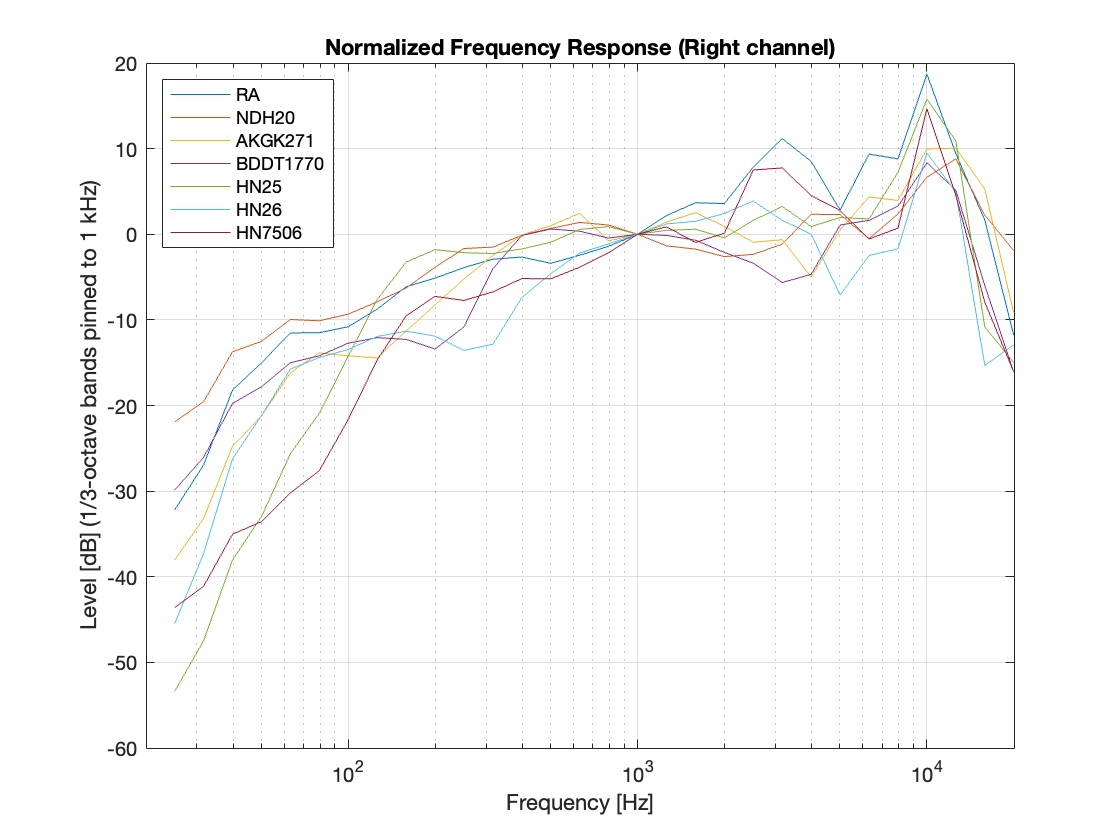
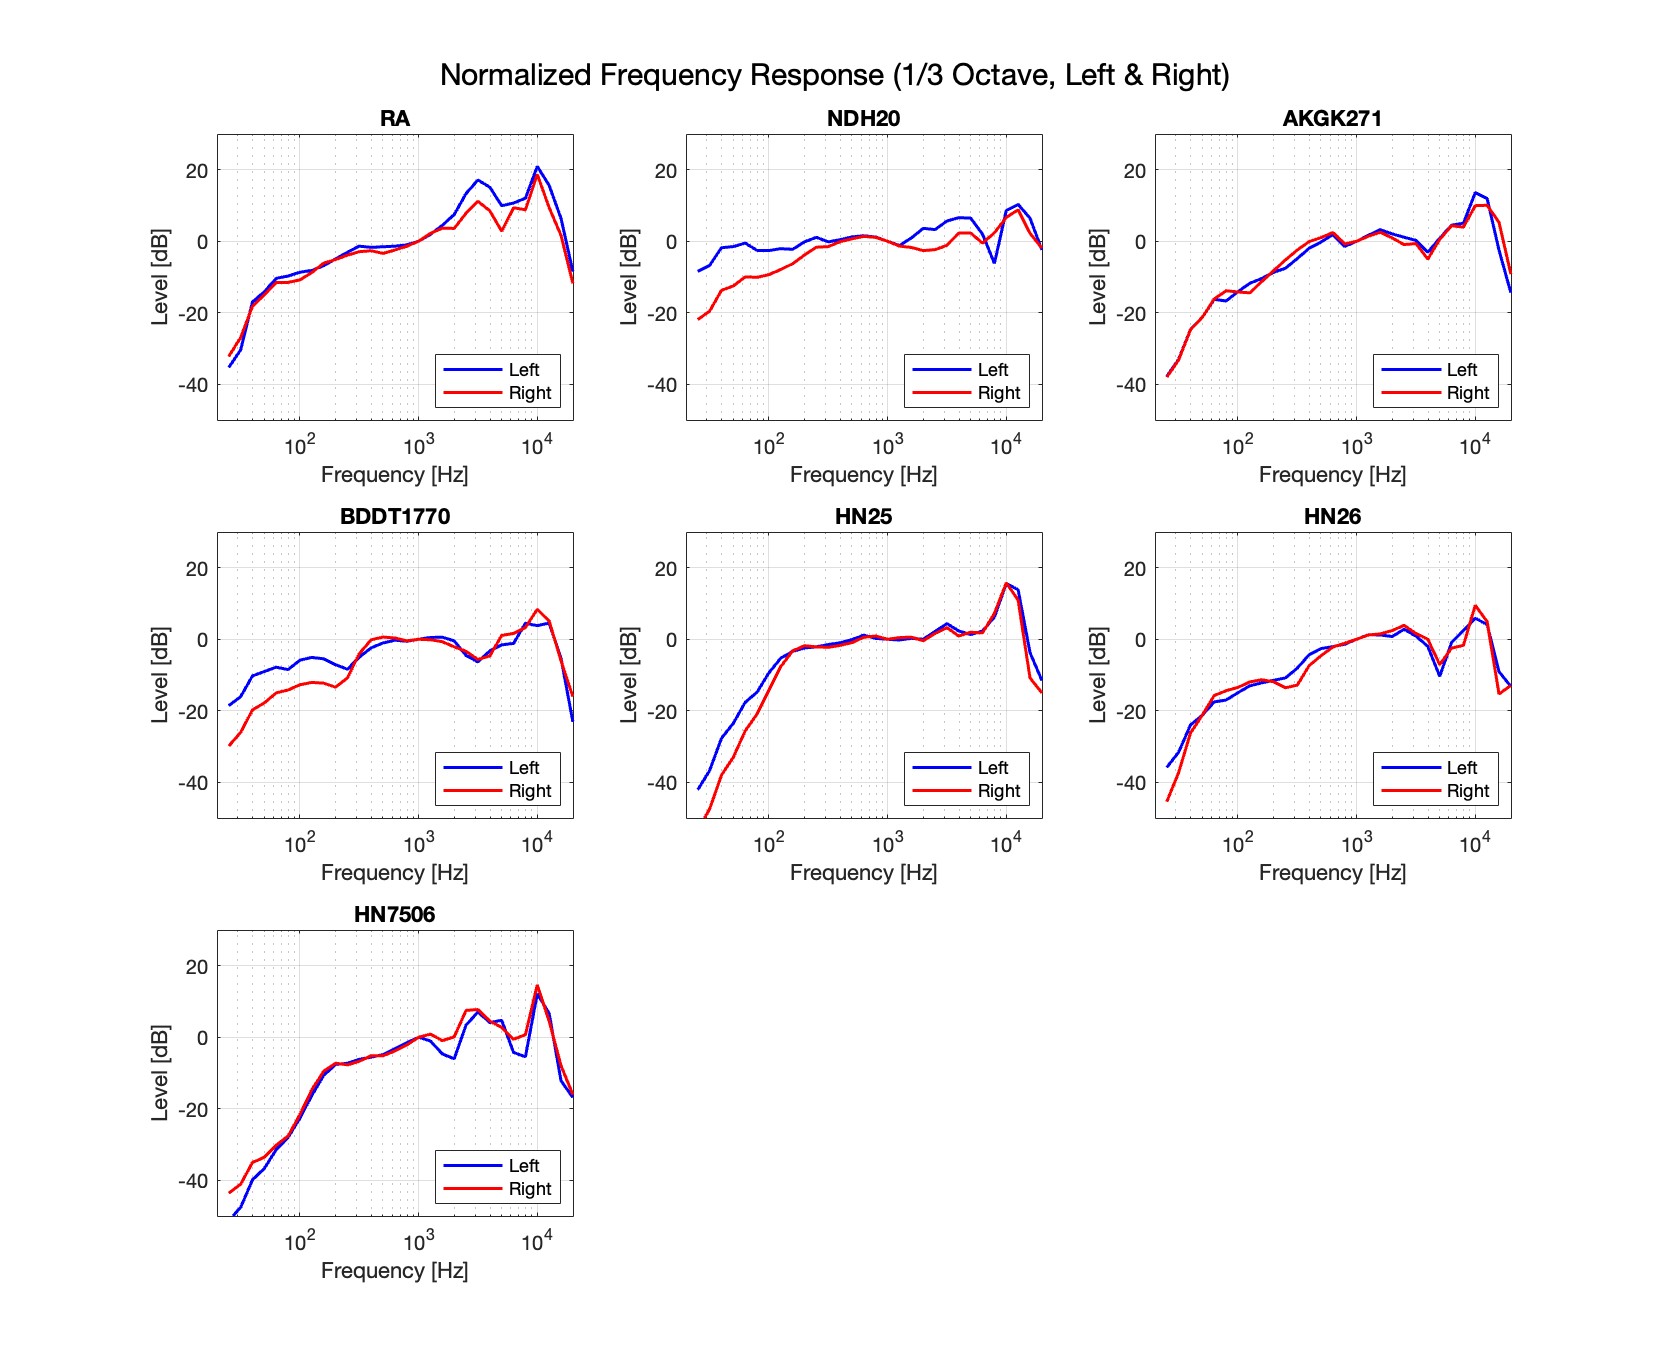
Figure 2 and 3 show the normalized frequency response curve of each headphone separated by channel. All curves were normalized to a relative amplitude of 0 dB at 1kHz to serve as a reference point to analyze high and low frequency deviations. In the low frequency range, the Neumann headphones (NDH20) show a significant boost around 70 Hz, which could indicate a warmer overall listening experience. The Remote Audio (RA) and Beyerdynamic (BDDT1770) show only a slight boost in this range, which suggests a balanced low-end presence. The Kortwich and AKG headphones (HN7506; HN26; AKGK271) have a very minimal boost in the low frequency range which may perhaps translate to a thinner overall sound. None of the headphones show an extreme mid-boost or mid-scoop, however in the high frequency region the Remote Audio (RA) headphones have a sharp peak around 10-12 kHz which indicates a bright, but potentially harsh sound. (Audio samples found in following section)
Figure 4 shows the same information as Figures 2 and 3, but plotted as a comparison of the left and right channels of each individual headphone. The symmetry seen within most of the individual headphones is encouraging, however there are some noticeable discontinuities. The variation between channels seen in the Neumann (NDH20) and Beyerdynamic (BDDT1770) headphones is unintuitive and could suggest a problem with the measurements due to headphone placement variability. These are notably the two studio headphones tested, which are equipped with large pads to provide comfort during long recording sessions- very slight malalignment could cause the discrepancies seen below. Other slight differences exampled by the AKG K271 or Kortwich HN26 phones are to be expected likely caused by the driver, a slight imbalance in its stiffness or damping, or again, placement issues.
The ideal and physically impossible headphone would show a straight line across all frequency bands, indicating a perfect reproduction of all frequencies. By this standard we once again see that, despite the incongruities between channels, the Neumann and Beyerdynamic studio headphones seem the most accurate in frequency reproduction which checks with their price point and intended purpose. Figure 4: Frequency response of each headphone shown individually as a comparison of Left and Right channels
Sound Isolation
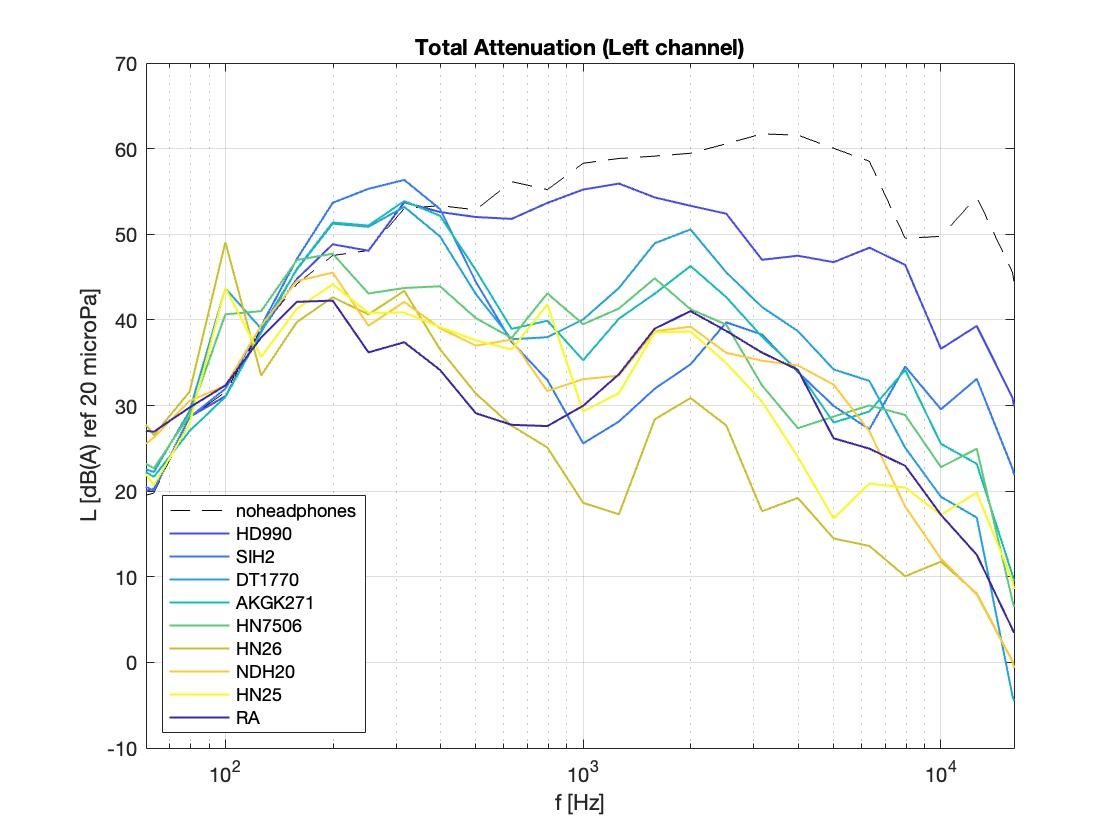
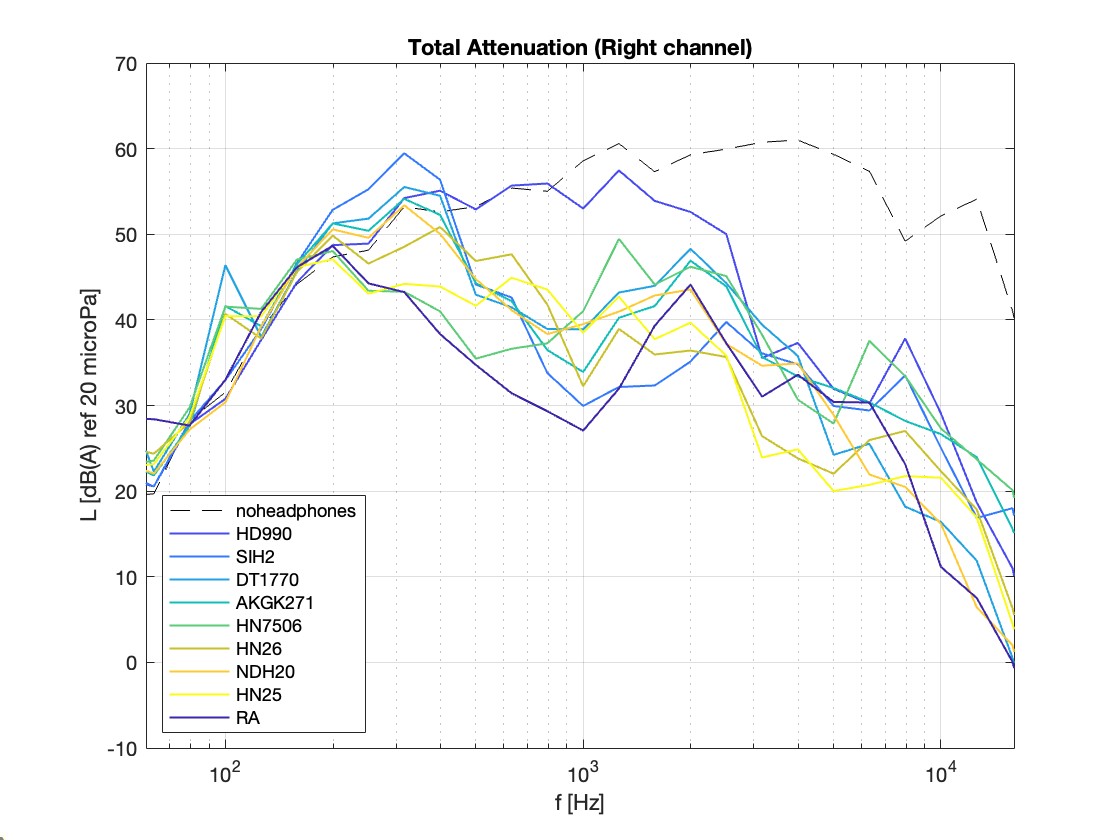
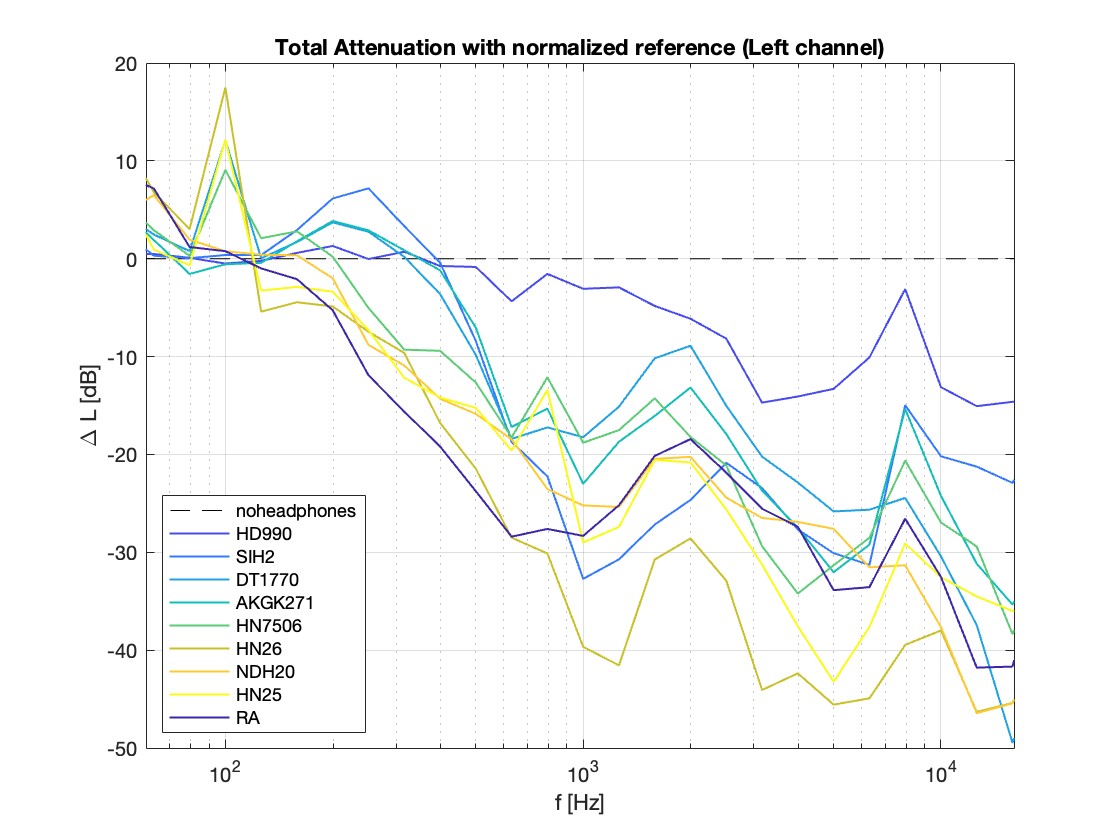
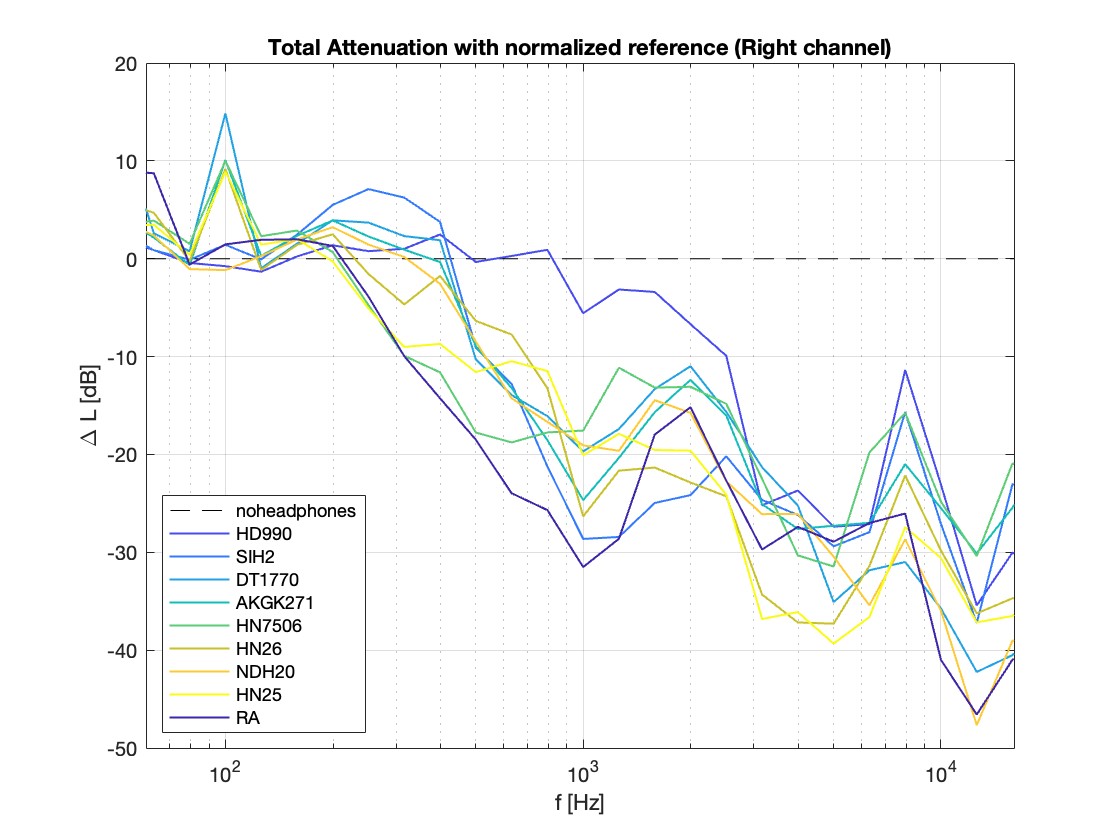
Figure 5 and 6 show level attenuation as a function of frequency plotted in 1/3 octave bands with a reference curve marked 'no headphones.' Figure 7 and 8 show the same information but with the reference curve (no headphones) pinned to 0 dB across the frequency spectrum. With this scaling, the erratic behavior at low frequencies becomes more apparent. The large spike at 100 Hz seen in multiple headphones remains a bit of a mystery, seeing that all headphones curves should hypothetically remain below the reference curve at all frequencies. After consulting with colleagues, two hypotheses arose as to why this result occurred. One, there could be some electrical noise (hum) within the measurement setup, potentially produced by faulty electrical components or impedance issues in the interface, power supply or surrounding equipment. Another possibility is that the hard shell of the headphone created a loud reflection at this frequency. Further testing would be required to test these theories.
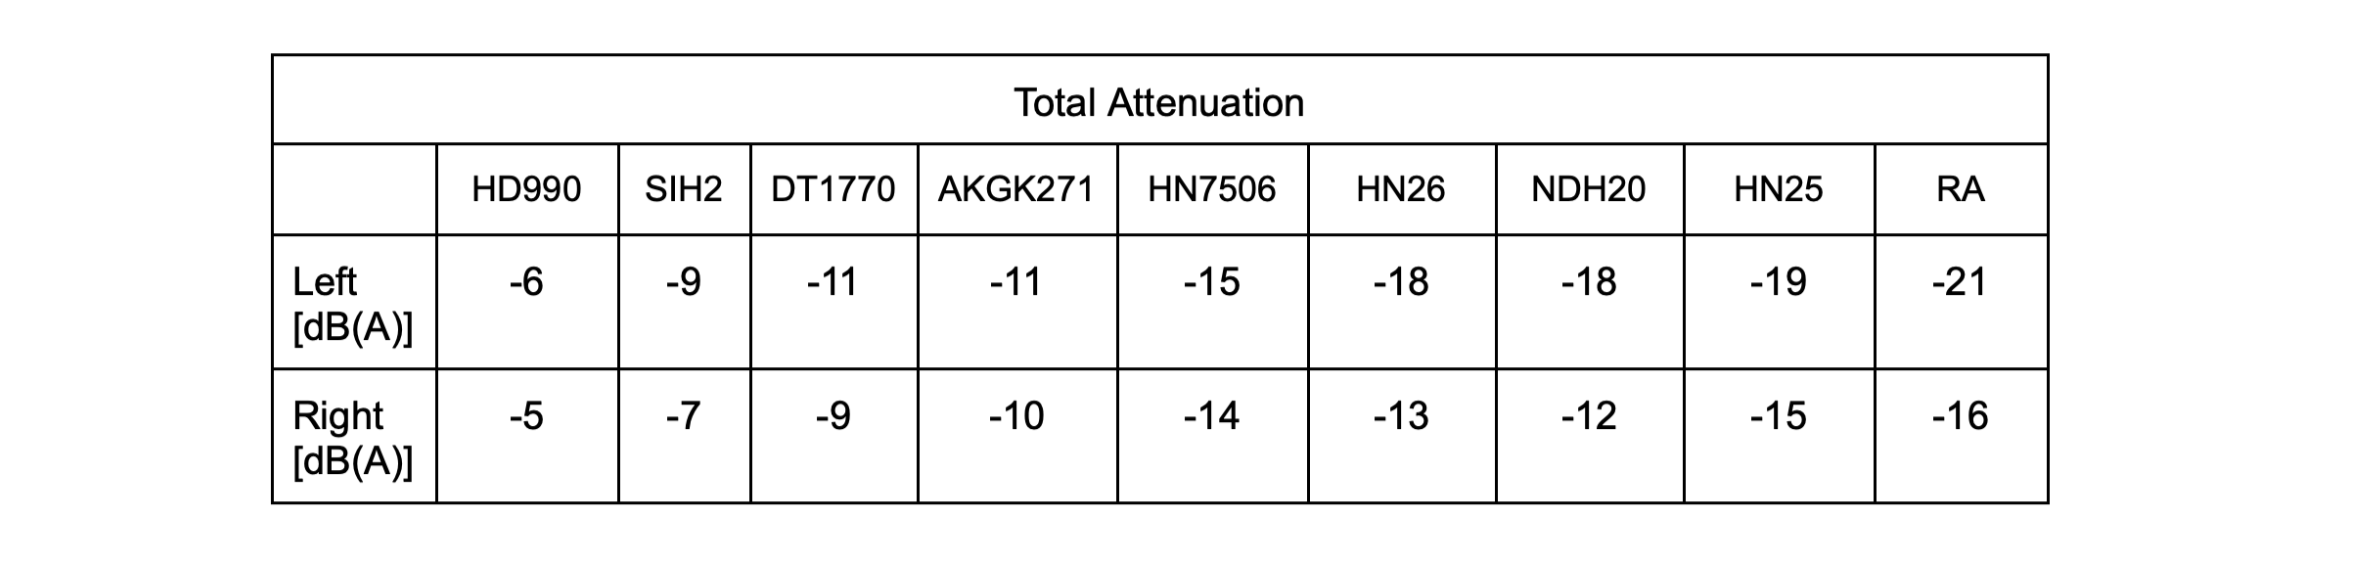
Despite the low frequency issues discussed and seen above, all headphone models show some attenuation when averaged across all frequencies. Table 1 shows the actual values of attenuation per headphone, calculated as an average reduction across all frequencies, with A-weighting applied. The Kortwich models (HN7506; HN26; HN26), having the same shell (driver not involved in SI measurement) should have the same attenuation levels, and here are close together in rank with a maximum difference of -4 dB(A). Possible differences could stem from manufacturing differences or again placement issues. The t.bone headphones (HD990) show the least attenuation, and the Remote Audio headphones provide the least. This is congruent with the manufacturers specs. HD990 being the lowest end model, and RA being created for high-noise recording environments.
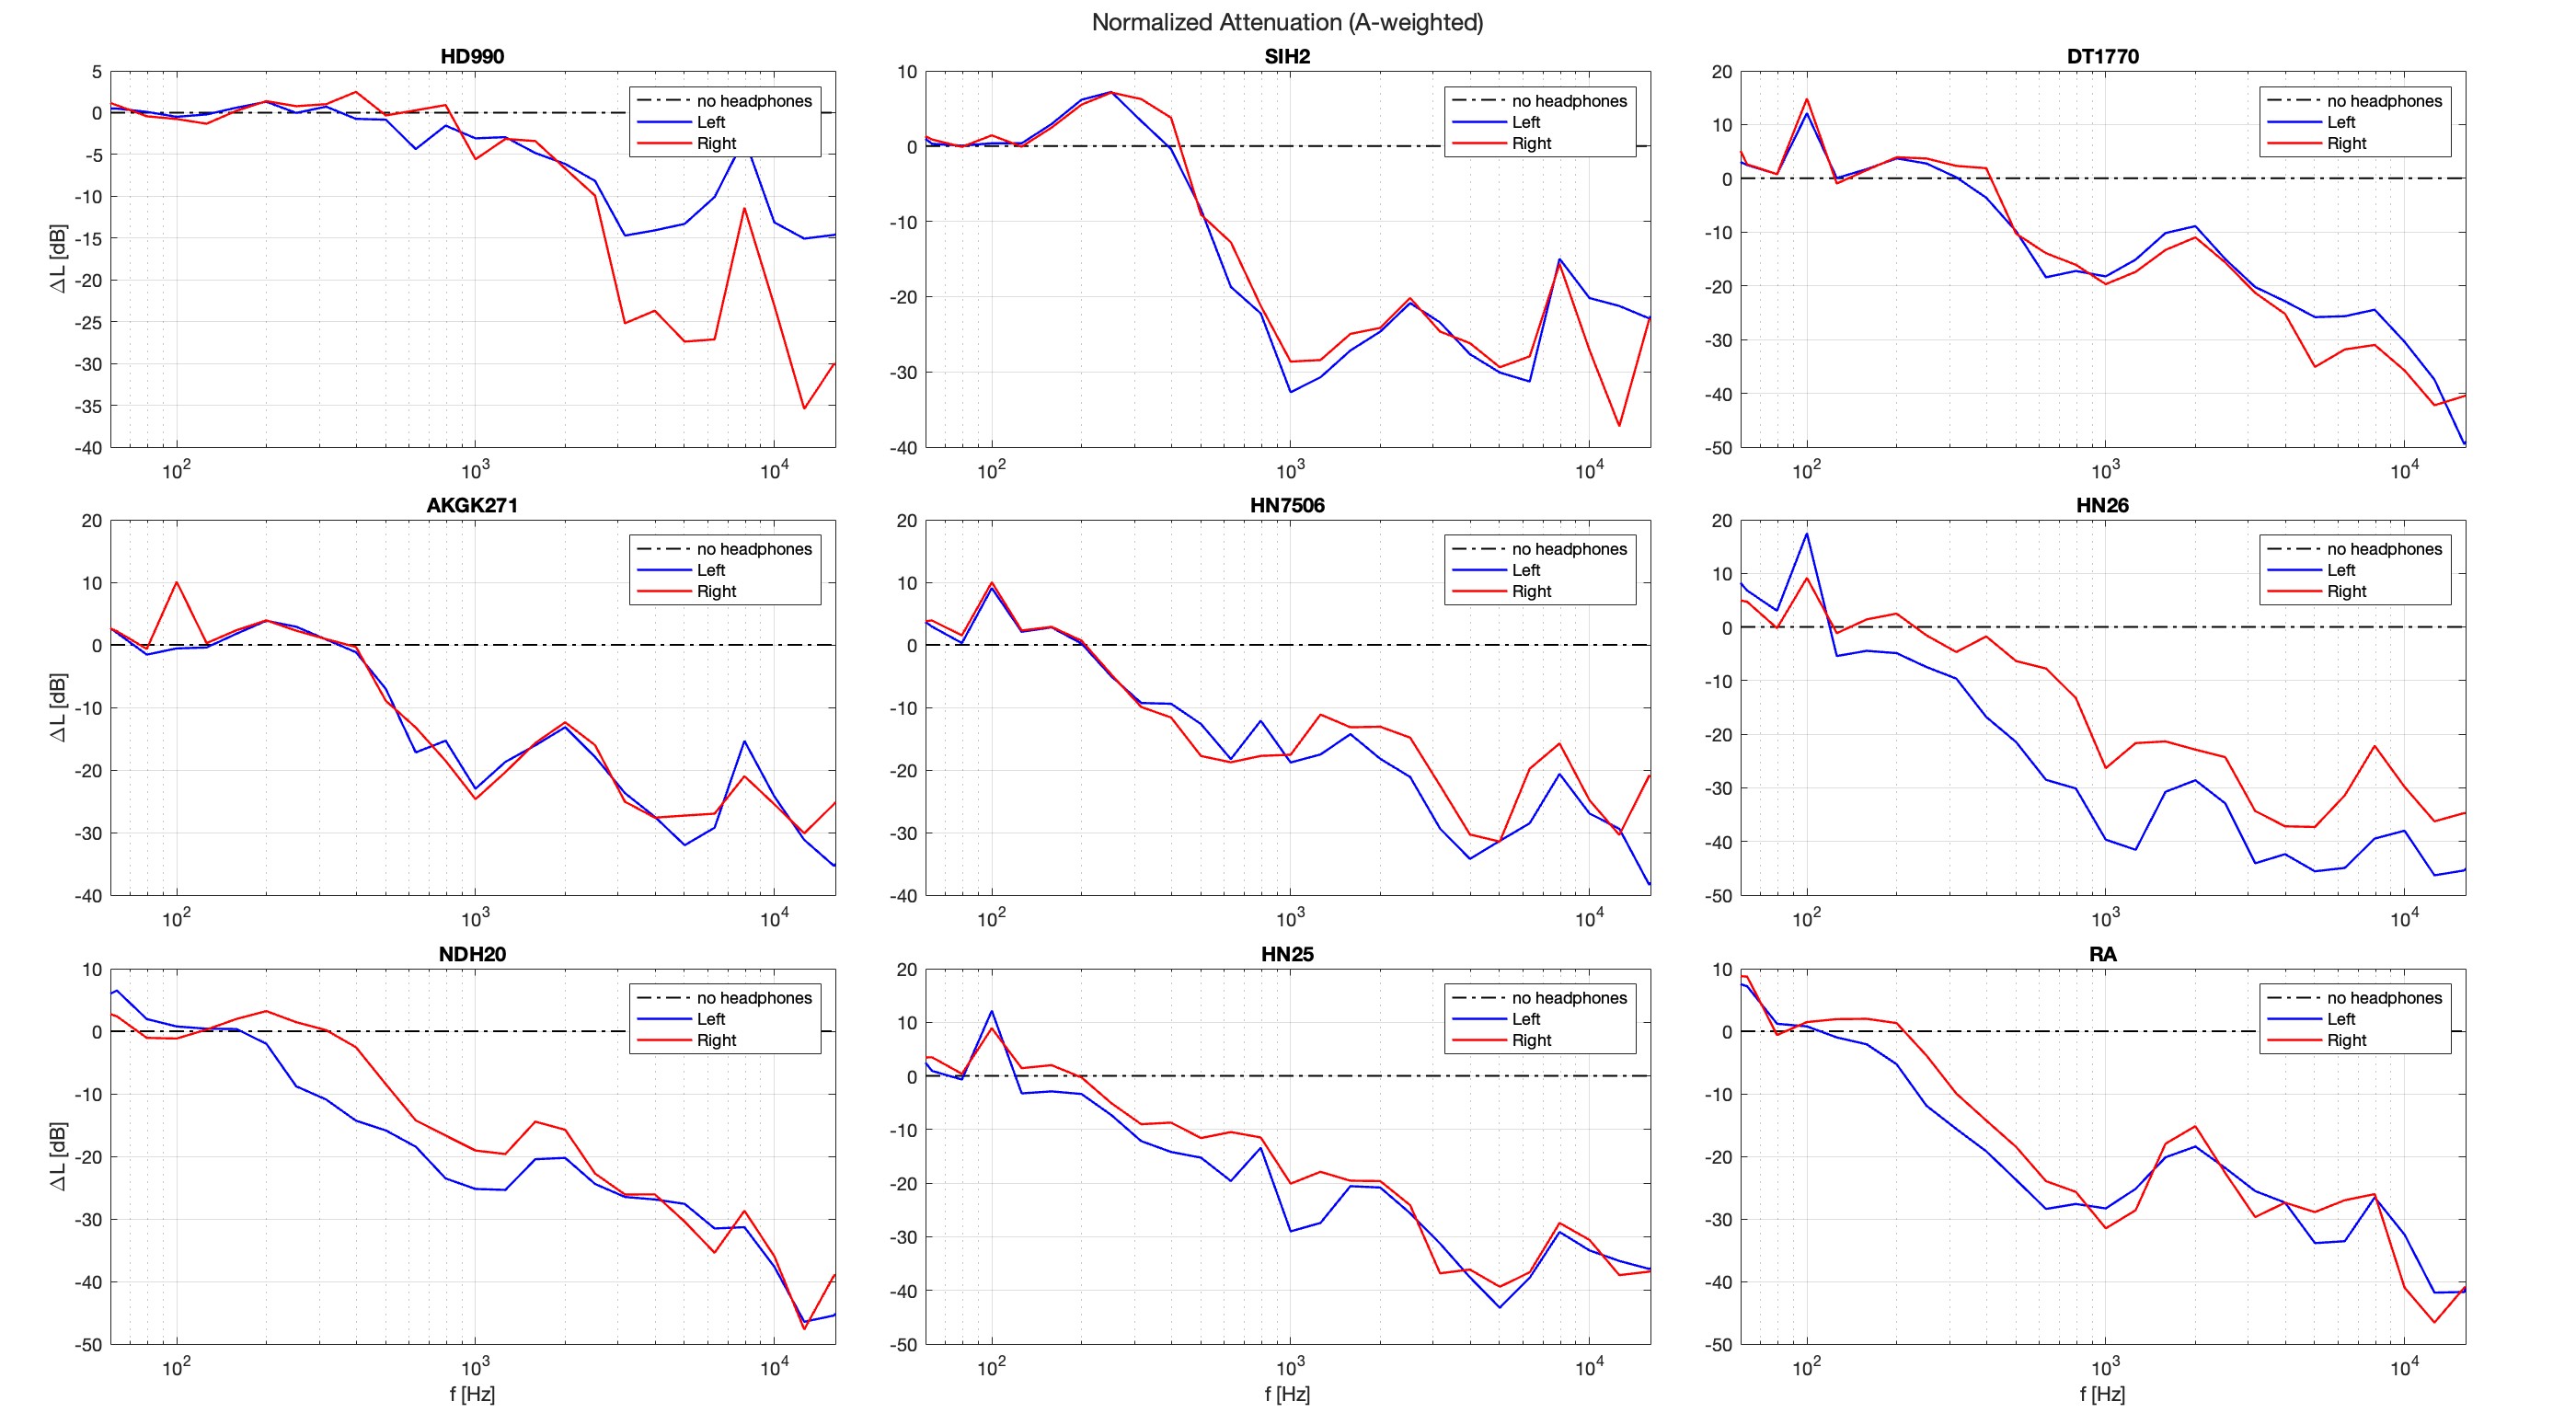
Figure 9 displays the attenuation across the frequency spectrum individually per headphone channel. The right and left channels are primarily consistent, confirming balanced attenuation. Although, slight variations exist between left and right channels for some models (HD990; HN26), possibly due to fit or seal variability. As discussed above, there is some positive gain at low frequencies (<200 Hz) in some cases, indicating potential resonance or measurement artifacts. The incongruities between channels in these measurements versus the frequency response measurements supports the previous hypothesis that fit/placement could be affecting the results greatly; a future version of this study could benefit from additional measurement runs per headphone to subtract the impact of any outliers. Also, manual data checks would be helpful in the early stages of acquisition to be sure that headphone placement is as accurate as possible.
The auralizations below were created from the measurement data to provide a track switch comparison. Impulse responses were computed and then convolved with sample audio. In order to highlight the timbral differences all stimuli in the frequency response stimuli were equalized to the same loudness. To preserve the attenuation effect, no loudness adjustment has been applied to the sound isolation audio demos. (Caution: this equalization is not reliable for any playback device. Headphone compensation for a broad variety of headphone models is made available by B. Bernschütz, “A Spherical Far Field HRIR / HRTF Compilation of the Neumann KU 100,” in Proceedings of the 39th DAGA, 2013, pp. 592–595. KU100. https://zenodo.org/records/3928297)
For the frequency response analysis, the visual and audio results correlate well. The incongruities between the left and right channels of the Beyerdynamic headphones (BDDT1770) for example, can be heard as a spatialization issue in the auralization. Also, the lack of low-end information and abundance of high-end information seen in Figure 4 for the Remote Audio (RA) headphones translates to a thin or tinny audio sample.
The sound isolation results show some artifacts in the very low frequencies, but create a useful comparison nonetheless. In general, the headphones become efficient at isolating the user from 1 kHz onward, most pairs showing very effective isolation in the high frequency range. In the auralizations that utilize a musical sample, the low buzz discussed in the Visual Results Section is noticeable, especially in the Kortwich models (HN-25 and HN-26).
Future research could include a comparison of this measured data to the official specs offered by the manufacturers of these headphones. An extension of this project would measure even more earmuff headphone models, specifically those designed for varied purposes (construction; studio; travelers etc.). A future project with a similar design could include active noise cancellation, exploring the differences between these two methods, and what overall effect they have on the listening experience- as well as the total loudness experienced by the user.